Tools

Centralized Monitoring using Excel and R
Regulatory and economic incentives prompt clinical research organizations to integrate risk management strategies into clinical operations and to adopt technological enablers for the efficient monitoring of clinical trials. XLSMetrics offers free open-source tools to monitor clinical trial remotely, namey using R to integrate different data sources and MS Excel to detect and analyze risk signals. XLSMetrics' tools fit in the Quality by Design concept of managing clinical trials with the ultimate objective to lower the cost and time to the development of medicinal products.
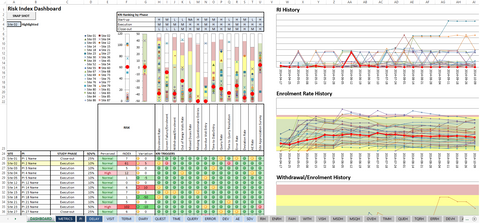
An Wholistic View of Risk
The Dashboard worksheet of the RI Calculator displays all your site-specific KRI relative values and signals sites which have KRI metrics falling outside of their respective threshold values. The wholistic perspective of all your sites KRI distributions and histories allows to determine the overall risk of your study as it progresses. The Dashboard also has a function to highlight sites of interest for focused, in-depth analysis.


Key Risk Indicators Metrics and Statistics
The Metrics worksheet of the RI Calculator provides statistics computed from the data imported into the workbook. It namely displays current calculated Risk indicators metrics and their periodic variation along with manually entered limits to compare the risk metrics against and trigger risk signals. The statistic including the means and standard deviations are displayed next to the limits for a quick statistical evaluation of set limits. The cumulative probability P[X≤xi], that a randomly observed value will be less than or equal to a calculated risk metric, is also calculated for each individual site’s risk metrics to help evaluate outliers.
Optimizing Site Visits with RBM
The PI worksheet of the RI Calculator displays individual site status including estimated workload which is useful for scheduling on-site visits optimizing site coordinators and CRAs’ precious time. Workload is calculated as a function of the number of subjects enrolled since last monitoring visit, the number of AEs recorded since the last monitoring visit and the number of pages which currently require SDV. The PI sheet also displays site-specific Query rate and Error rates, as these metrics are especially important to determine the level of SDV required at individual sites for Risk-Based Monitoring.


Reviewing Risk
KRI metrics histories of the RI Calculator display how risk progresses during your study and allows to evaluate the impact of mitigation actions and determine if risks are properly managed. KRI metrics histories also allows for the assessment of the fitness of set threshold limits with respect to calculated metrics to effectively identify outliers. The information contained in the KRI metrics histories is instrumental to risk review and the traceability of your risk management process. It is displayed in a fashion that eases communication with clinical operations.
Terminal Digit Analysis
Deliberate data fraud is rare but can have significant impact on trial integrity. One straightforward way to fabricate data is to take existing data and copy them within or across study subjects. Such a data propagation method results in certain values occurring more often than others as humans tend to favor certain digits when fabricating numbers. A simple way to detect this type of data fabrication is to calculate the frequency of terminal digits from data collected. The Data Fraud Detector has been designed to do just that.


Inlier Analysis
Real subject-specific data are expected to vary to a certain extent from one physician’s office visit to the next. An inlier analysis can be used to detect whether this is the case or not. Inlier analysis specifically evaluates how close to their respective means a set of multivariate observations lies and suggests fabrication if those observations, taken together, lie abnormally close to their respective mean. The Data Fraud Detector can be used to perform this type of analysis.
R Codes
Some programming skills are required to become fully data-driven. R is a free open-source programming language used largely by academia and the healthcare community for statistical computing and dataset manipulation. Using the integrated development environment RStudio, R can be used to write codes that extract the important information out of any dataset and transfer it into the RI Calculator, thereby integrating all data sources into a centralized monitoring tool. In addition to the many R user forums, XLSMetrics R code templates provides examples of such codes used in conjunction with the RI Calculator.

![]()
Documenting Risk Management Processes
Tools and processes for the implementation Central Monitoring require supporting documents. A Quality Risk Management Plan (IQRMP) presents the quality management strategy including the activities of risk-assessment, KRI calculations and central monitoring which are to be implemented in the course of study. Validation Plans and associated validation scripts ensure the proper working of risk calculation tools. User manuals supports the transfer of knowledge between staff assigned to the operation of risk calculation tools. Central Monitoring Reports contains periodic analysis of risk signal that are communicated to stakeholders and ensures the traceability of the central monitoring process. XLSMetrics can assist in the production of those documents.